I just bumped into a little issue in ggplot2 that makes sense, but I was surprised. It looks like there are two things going on, one of which is a very basic thing about how ggplot2 adds geom‘s, but the other is about how various plotting devices deal with overlapping data.
As recognized a decade ago, if you use geom_text to print a label without specifying a data.frame, the geom will use the aesthetics passed previously in the ggplot call, and can plot the same data many times in the same location. The function ggplot2::annotate() deals with this elegantly by defining a mini geom that doesn’t map data from a data.frame at all, but instead passes simple vectors defined in the annotate call. I just added a little answer (copied here) to a decade-old question on Stack Overflow, illustrating this difference.
The thing I still don’t entirely understand is why plotting the same text over and over in the same place creates the fuzz, but I’ll save that rabbit hole for another day.
# load library
library(ggplot2)

# example plot
df <- data.frame("x" = c(1,2,3,4),"y" = c(15,19,35,47))

p <- ggplot(df, aes(x,y)) +
  geom_point(size=1) +
  geom_smooth(method = "lm", se=FALSE, formula=y~x)


# lousy resolution from `geom_text()`

p + geom_text(aes(x = 3.5, y = 37, label ="123456789"),size=12, parse = TRUE)

# but fine resolution from `annotate()`

p + annotate("text", x = 3.5, y = 37, label ="123456789", size = 12)
ggplot2::geom_text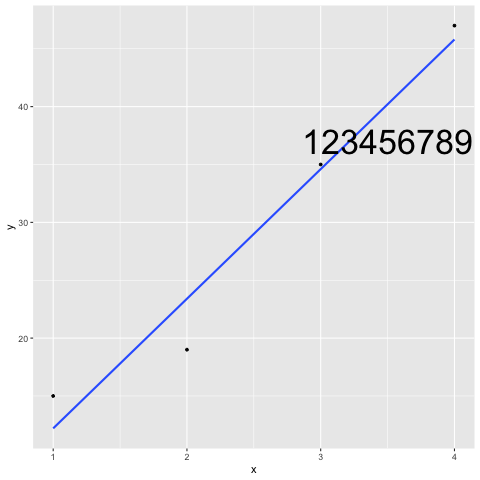
ggplot2::annotate() instead